CTV interview with Bruce Langhus about climate change in Gagetown, NB-
https://atlantic.ctvnews.ca/video?clipId=1681166


Environment Canada (EC) has measured and archived weather data (temp, precipitation, humidity, etc) for approximately 100 years at many locations. Below are graphs of this data from locations around the Saint John River watershed. It is the Saint John River that floods every spring and threatens communities nearby. The weather data will be used to measure climate change in Western NB and chart its effects on annual flooding.
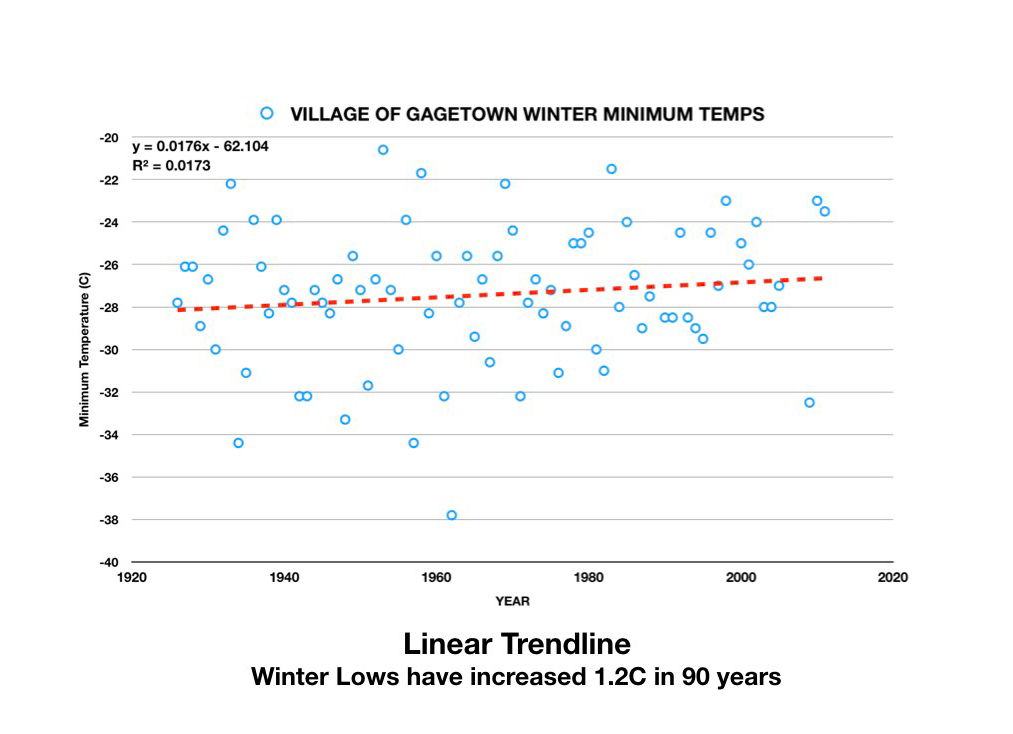
The Village of Gagetown is located on the Saint John River approximately half-way between St. John and Fredericton. Temperature data have been collected since approximately 1924. A simple plot of winter lows is presented above — each year the single lowest reading is plotted. In addition a trend line is calculated and plotted; the line bisects the data so that spread from the line is equalized. On this particular graph, winter lows have increased 1.2C in 90 years. Similarly, annual summer highs can be graphed or monthly temp data.

The table above is a summary of four temperature measures across the nine Saint John River stations. Individual stations are shown as well as measure average. All stations except for Edmunston show consistent increases in the past 100 years, nonetheless data are erratic. Temperature averages are quite close and parallel the increases seen by EC across Canada. Growing season is measured by degree-days above 5C; these data are erratic but have an average of approximately 150DD or about two weeks extra growing season increase since the 1900s.

The graph above casts annual rainfall totals at Oromocto. Precipitation will depend on air temperature but also jetstream patterns, storms, and other large-scale features. The trendline that best fits these plots is a higher order polynomial as shown above. As would be expected with rising temperatures, rainfall has increased at Oromocto with a particularly strong increase in the past 20 years.
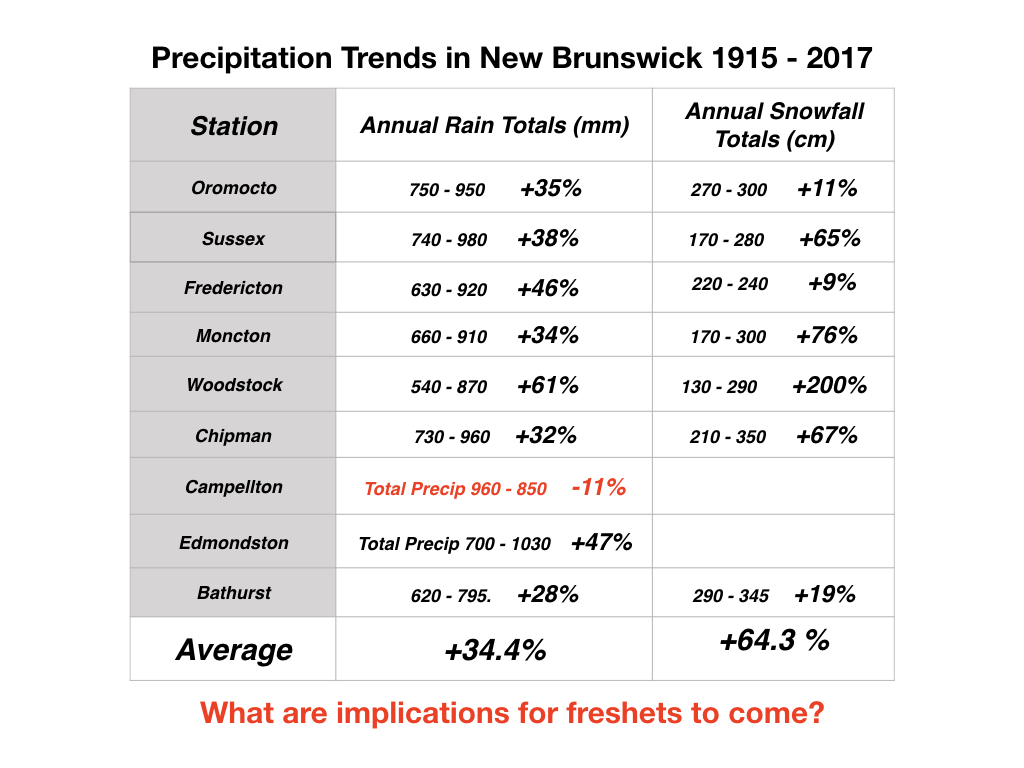
Table above summarizes the annual precipitation trends in the Saint John River watershed. It can be seen that both rain and snow have increased across the area. Not all of this precipitation will affect the spring floods, however. Rain happening in the summer and fall will not be around to contribute to the spring flooding. Winter snowfall may or may not contribute to spring runoff. Of more interest are spring rain and snows.

The graph above concentrates on April precipitation at Edmundston in the northern part of the watershed. The graph is quite interesting — the strongest outlier is the approximately 175mm total seen in 1973, the year of a historically high freshet. The increase of 100% is certainly compelling. The strong increase since 2000 coincides with historical flooding in 2008 and the highest floods ever in 2018 and 2019. This April data suggests strong freshets will be the rule in this time of climate change.
Future Trends

The graph above documents annual high temps at Fredericton projected between approximately 1920 and 2100. At 2100, summer highs will be approximately 35C and extreme highs will be approximately 40C. This is the temperature range today in Baltimore, Maryland.
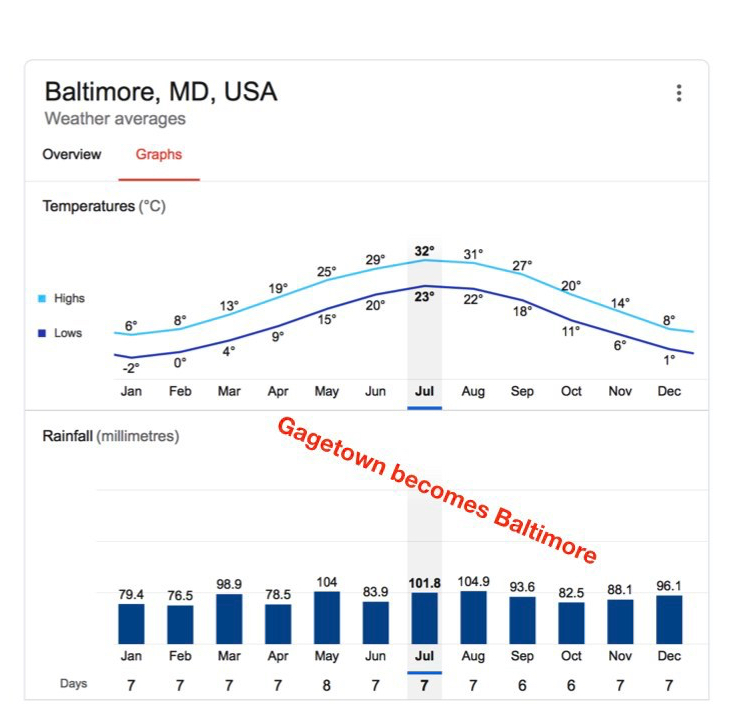
In 2100, residents of the Fredericton area can expect average summer highs everyday of 32C, only a few frost days each winter, and 29% more rainfall. This climate will be much different than 2019 with strong effects on people, plants, and animals.

Chart ranking the efficacy of personal mitigations.

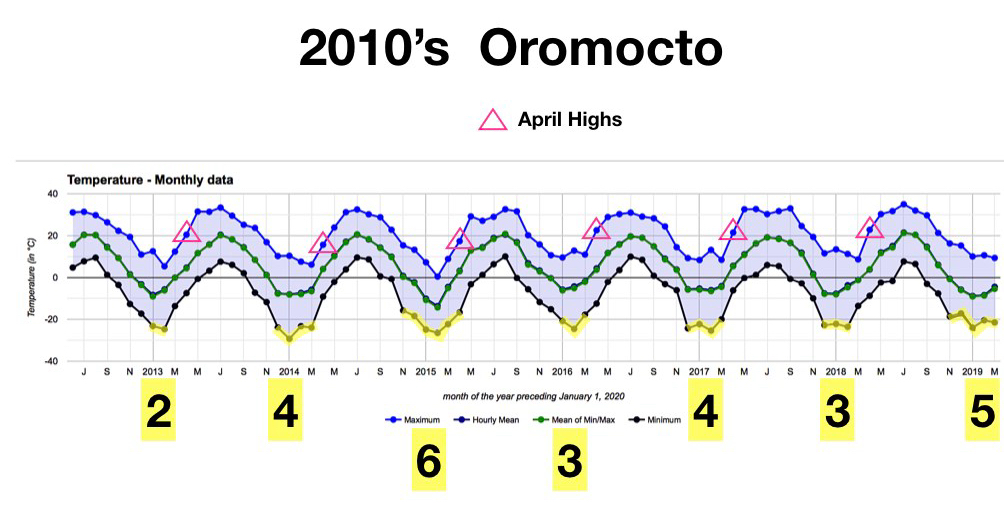

Plots above compare snapshots of monthly temperature data for Oromocto in the 2010s and the 1940s. The biggest change appears to be the length (length in moths shown for each year in yellow) and severity of winters. Winters in the 1940s were shorter but colder than currently.
Clearly a more detailed analysis is required to fully understand climate changes and predict spring flood strength. Analysis would examine daily temperature and precipitation data combined with river flow volumes on a daily basis. A Factor Analysis would pick out the most important factors and identify which variable contributed to the factors.

You must be logged in to post a comment.